Forest Plot with transforms#
See also
API Documentation: plot_forest()
import arviz as az
import matplotlib.pyplot as plt
import numpy as np
non_centered_data = az.load_arviz_data("non_centered_eight")
def log_transform(data):
"""Apply log transformation, avoiding log(0)."""
return np.log(np.maximum(data, 1e-8))
def exp_transform(data):
"""Apply exponential transformation."""
return np.exp(data)
def center_data(data):
"""Center the data by subtracting the mean."""
return data - np.mean(data)
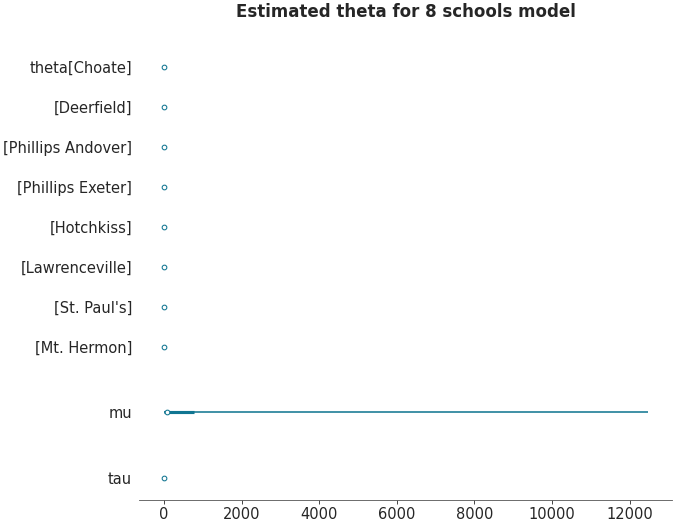
axes = az.plot_forest(
non_centered_data,
kind="forestplot",
var_names=["theta", "mu", "tau"],
filter_vars=None,
combined=True,
figsize=(9, 7),
transform={"theta": center_data, "mu": exp_transform, "tau": log_transform},
)
axes[0].set_title("Estimated theta for 8 schools model")
plt.show()